2014 / 2015
Conconi Interpretation
Jahrgang
Projektpartner
HLSZ Linz (Heeresleistungssportzentrum)
Maturanten

Mühlberger Tobias
5AHWII

Neißl Rene
5AHWII
Betreuer
Furtmüller Werner
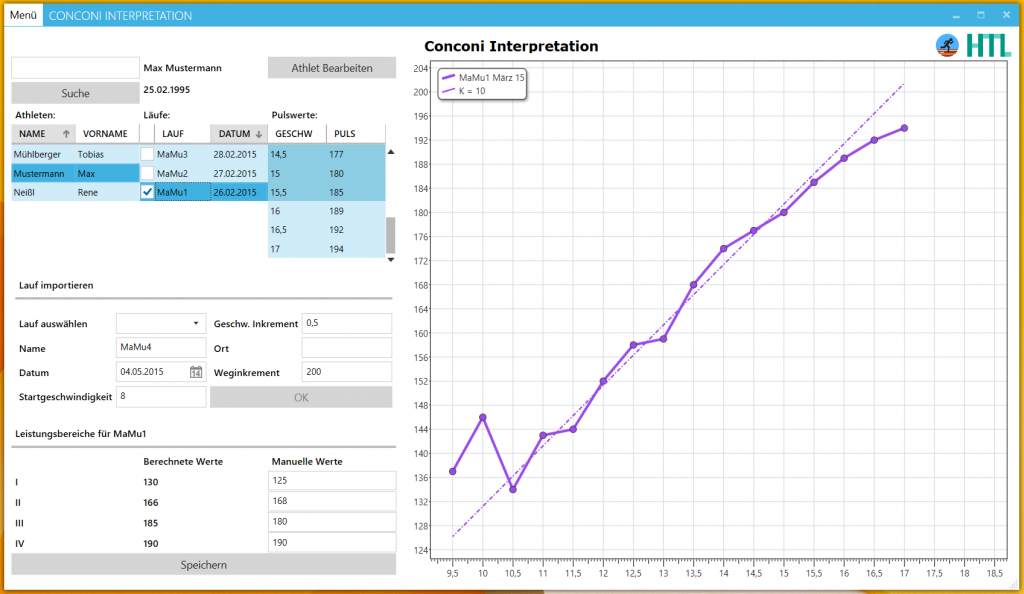
Der Conconi Test wurde vom italienischen Biomechaniker Francesco Conconi entwickelt. Dieser Test ist von besonderer Bedeutung, weil er genau darlegt ob ein Athlet über- oder unterbelastet ist. Der Athlet muss seine Laufgeschwindigkeit in gleichmäßigen Abständen steigern, während des gesamten Tests zeichnet eine Pulsuhr die Pulswerte auf. Das Ergebnis des Conconi Tests wird als Diagramm darstellt, welches den Puls pro Geschwindigkeit abbildet. Daraus kann der Trainer Informationen über seine Leistungsfähigkeit und eventuelle Trainingsfehler ermitteln. So kann später ein individuelles Training für den Athleten zusammengestellt werden.
Die Aufgabe besteht darin, die Pulsuhrdaten mittels Infrarotverbindung aus der Pulsuhr auszulesen und entsprechend den Vorgaben für die Darstellung als Diagramm aufzubereiten. Die Daten werden zusammen mit einem Profil des Läufers in einer Datenbank abgelegt, sodass sie jederzeit wieder abgerufen werden können. Es können ein oder mehrere Läufe eines Athleten in einem Diagramm dargestellt werden, zur Ermittlung der Steigung kann eine Regressionsgerade eingeblendet werden. Dadurch hat der Trainer die Möglichkeit den Trainingserfolg zu beurteilen.
The Conconi test was developed by Francesco Conconi, an Italian sports doctor and scientist. It is very important, because it clearly shows whether an athlete is over- or underloaded. During the test the athlete increases the running speed in certain intervals. During the whole test a heart rate monitor watch records the pulse of the athlete. The result is displayed as graph in a pulse-velocity diagram. This gives the trainer information about the capabilities of the athlete, and about potential training errors. That way an individual training can be put together.
The goal of the project is to read the collected data from the pulse monitor via an infrared connection, and to process it according to the specification. The processed data is stored, together with a profile of each athlete, in a database. That way runs can still be accessed later. The software can also display several runs of an athlete in one diagram. That way the trainer can compare runs and see how an athlete has developed. To determine the angle of graph a regression line can be displayed.


